How to Profile Clojure Code
I had some trouble to find a straight answer on how to profile a Clojure application to find CPU hotspots. After some searching and tinkering, I ended up with these steps that worked for me:
1. Download, install, and launch VisualVM. VisualVM is definitely good enough for basic profiling. If you want more detail, you might want to give YourKit a try. You'll have to pay a license for YourKit, though.
2. Add the following to your Leiningen project.clj file. Either in a profile or on the top level:
:jvm-opts ["-Dcom.sun.management.jmxremote"
           "-Dcom.sun.management.jmxremote.ssl=false"
           "-Dcom.sun.management.jmxremote.authenticate=false"
           "-Dcom.sun.management.jmxremote.port=43210"]
This will enable Java Management Extensions (JMX) for the Clojure JVM process. VisualVM uses these extensions to profile the JVM process. The port 43210 is arbitrary, pick what you like.
3a. If you are running the Clojure application on local host continue with step 6.
3b. If the Clojure application is running on a remote host:
4. Connect to the remote host and open a SOCKS proxy with ssh:
ssh remote_host -D 9191
This will allow VisualVM to connect to JMX on the remote host. Strangely, just forwarding a single port (with -L) has not worked for me. Apparently VisualVM needs more than one connection.
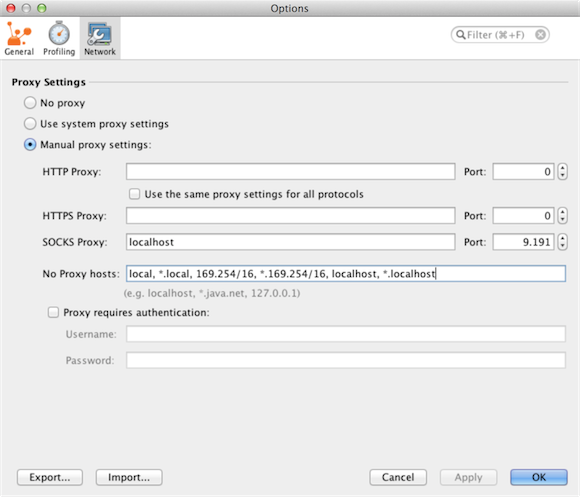
5. Enable SOCKS proxy in VisualVM
On Mac OS X, go to VisualVM → Preferences.... Then select the Network tab in the VisualVM app.
Enable Manual proxy settings; then set the SOCKS Proxy: to localhost with port 9191.
Change the No Proxy hosts to local, *.local, 169.254/16, *.169.254/16, localhost, *.localhost.
It is important that 127.0.0.1 is not part of that list.
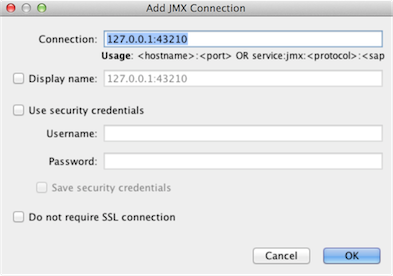
6. Attach to the running Clojure process:
Go to File → Add JMX Connection...
Enter 127.0.0.1:43210 as the Connection.
7. Start profiling
Select the Sampler tab and click the CPU button.
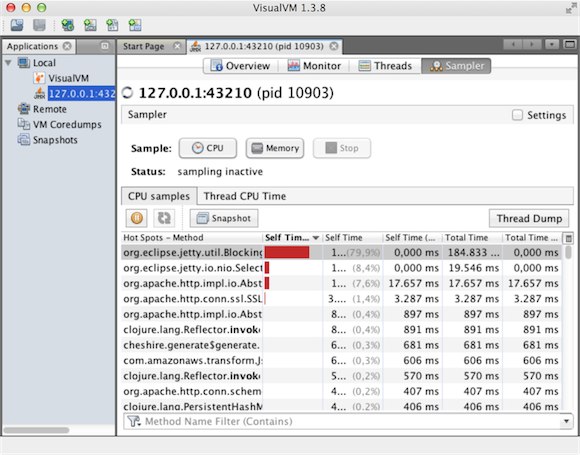
Happy optimizing!